
Data Analytics Course in Connaught Place | CP, New Delhi
From messy spreadsheets to dashboards your manager will actually open. Four months of live classes in Excel, statistics, Python, SQL, Power BI and Tableau, a short walk from Rajiv Chowk Exit Gate 2.
- 4 months live
- Excel → SQL → Power BI
- 10 industry capstones
- Hybrid batches
- Minimum 5 interviews or 1 year free learning *T&C
- Open all 7 days
- 4.5/5
Google Rating
- 74,356+
Learners Trained
- 750+
Hiring Partners

Best Vocational Institute 2026Entrepreneur India
10 industry capstones4 months live
- Where
- 2nd Floor, Indra Palace Tower, H Block, above Bank of India, near Rajiv Chowk Exit Gate 2
- Hours
- 10:00 AM to 7:30 PM, all 7 days
- Modes
- Classroom and live online batches
- Duration
- 4 months of live classes (Skill Degree in Data Analytics)
Why SkillCircle: Founded 2016 · 74,356+ students trained · 15+ centres in 10 states · 750+ hiring partners · Best Vocational Institute 2026 (Entrepreneur India), presented by Union Minister Piyush Goyal
Find us in H Block, CP
Drop in for a free demo and a straight answer on which batch suits your hours.
Address & contact
- Address2nd Floor, Indra Palace Tower, Block H, 16, Exit Gate 2, above Bank of India Building, Connaught Place, New Delhi, Delhi 110001
- AreaH Block, inner Connaught Place, by Rajiv Chowk metro Exit Gate 2
- Phone+91-8882928868
- Hours10:00 AM to 7:30 PM, all 7 days
The CP centre
Our classroom is on the 2nd floor of Indra Palace Tower.
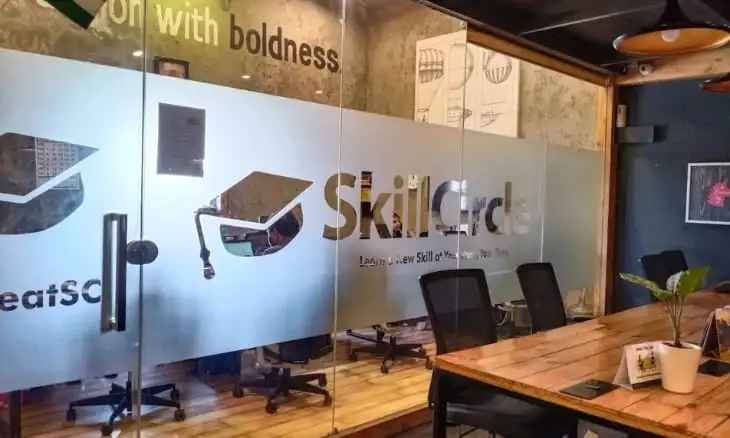
Analysts commute to CP from across Delhi
If your office is around the outer circle, the centre is a walk away; if not, Rajiv Chowk puts most of Delhi on a direct line.
- Rajiv Chowk metroBlue and Yellow Lines meet here. Leave by Exit Gate 2, walk to H Block and look for the Bank of India building; we are on the 2nd floor above it.
- North Campus & GurugramYellow Line straight to Rajiv Chowk, no change needed.
- Dwarka & NoidaBlue Line straight to Rajiv Chowk, no change needed.
- Karol Bagh, Paharganj, Mandi HouseA short metro ride or auto to the outer circle.
- Barakhamba Road, Janpath, Gole MarketWalkable on most days.
- Short on time?Join the same class live online on days you cannot get to CP.
Call +91-8882928868 for the easiest route from where you are.
Spending your day in Excel near CP? Start analysing it.
A lot of people who work around Connaught Place, in banks, agencies and consulting offices, already spend their day in spreadsheets without really analysing anything. This course turns that habit into a skill: pull the data with SQL, clean it in Python, and show it in a Power BI dashboard.
Final-year DU students use the same route to get SQL and Power BI on their CV before placements. Hybrid batches mean you can come to H Block on some days and log in on others.
Who joins data analytics at CP
No coding background needed. You start with Excel and build up.
Final year at DU
Every job post asks for SQL and Power BI; this is where you get them.
Banks, agencies, consulting
Turn your daily reports into analysis people trust.
B.Com, BBA, BA
A field where your dashboards speak for you.
What analytics students get in CP
A classroom at Rajiv Chowk, 10 capstones and honest placement help.
H Block, 2nd floor
Classroom batches with live online backup.
Excel to Tableau
Excel, statistics, Python, MySQL, Power BI and Tableau in one track.
Minimum 5 interviews or 1 year free learning
An interview guarantee, not a job guarantee (*T&C apply).
10 capstones
Across BFSI, FMCG, healthcare, automobile and entertainment.
15+ centres · since 2016
74,356+ students trained, 750+ hiring partners.
#JobCircle
Openings from hiring partners on our job portal.
How analytics runs at the CP centre
Six things worth knowing before you sign up.
Classroom or live online
Same syllabus whether you sit in class or log in, with recordings when you miss a day.
Excel first, then SQL
You build up from spreadsheets to SQL, Python and BI tools, one month at a time.
Power BI and Tableau
Power Query, modelling and DAX in depth, and Tableau for advanced visuals.
10 capstones
Two each from BFSI, FMCG, healthcare, automobile and entertainment.
Hybrid batches
Batch timings that fit around college or office hours; ask the counsellor what is open.
SQL and case practice
The SQL and case questions analyst interviews keep asking, drilled before you apply.
SkillCircle CP or another route?
If you are weighing a recorded course or another institute against us, this is how the options usually differ.
| SkillCircle | Typical online-only course | Typical local institute | |
|---|---|---|---|
| How classes run | Classroom batches at our Connaught Place centre, plus live online batches | Recorded videos you watch on your own | Classroom only, usually one fixed batch |
| Doubts | Ask the trainer in class or in the live session | Mostly forums or email | Depends on the trainer |
| Practice | 10 industry capstones across 5 sectors | Often self-checked assignments | Varies |
| Placement support | Minimum 5 interviews or 1 year free learning (*T&C), plus resume help, mock interviews and #JobCircle openings | Usually a job board, or none | Varies, often informal referrals |
| Fee | ₹40,000 – ₹1,60,000 depending on the programme; EMI through Bajaj Finance | Often the cheapest option | Varies |
Online-only courses suit people who are self-driven and need full flexibility. If you want fixed class hours and a trainer you can ask in person, a centre helps. Choose what fits how you learn.
Data Analytics programmes
Open a programme page for the full syllabus. A counsellor can tell you which intake is open at your centre.
Skill Degree in Data Analytics
For: students, B.Com/BBA/BSc grads and anyone who lives in Excel. Excel, statistics, Python, SQL, Power BI and Tableau, with 10 industry capstones.
Executive Certification in AI-Native Data Science & Analytics
For: working professionals who want the longer route, run in collaboration with IIT Patna Vishlesan I-Hub Foundation.
Data Analytics course curriculum
7 blocks from our main data analytics course page. Pick a module to see what it covers.
- Modules
- 14+
- Duration
- 4 months
- Capstones
- 10
- Mode
- Classroom + live online
Excel for analytics
Module 1 of 7- Formatting, sorting, filtering
- IF, COUNTIF, SUMIF, VLOOKUP
- Pivot tables and dashboards
Statistics
Module 2 of 7- Variable types and sampling
- Central tendency and dispersion
- Normal distribution, skewness, kurtosis
- Hypothesis tests: t, z, chi-square, ANOVA
Python
Module 3 of 7- Data types and structures
- Loops, functions, lambda/map/filter
- Classes, files and exceptions
EDA with NumPy and Pandas
Module 4 of 7- Arrays and reshaping
- Series and DataFrames
- Cleaning, merging, grouping, pivots
Visualisation
Module 5 of 7- Matplotlib
- Seaborn statistical plots
- Plotly interactive, map and 3D charts
MySQL
Module 6 of 7- CRUD and aggregation
- GROUP BY and HAVING
- Joins and subqueries
Power BI and Tableau
Module 7 of 7- Power Query
- Relationships and data modelling
- DAX measures
- Interactive dashboards
Projects and tools. Work you can show.
Capstones you can walk an interviewer through, built with the tools teams use.
HR analytics: attrition
- Find out why people quit and what might keep them
- Excel
- Power BI
Sales and revenue forecasting
- Predict next quarter from real data
- Python
- Pandas
Customer segmentation
- Group customers so marketing stops guessing
- Python
- SQL
BFSI sector analysis
- Banking and finance data, sliced the way analysts do it
- SQL
- Tableau
Supply chain demand forecasting
- Predict demand so inventory is not a guess
- Excel
- Python
Review sentiment analysis
- What customers actually think, measured
- Python
E-commerce order analysis
- Orders, returns and delivery patterns
- SQL
- Power BI
Inventory management report
- The report ops teams check every morning
- Excel
- Power BI
Projects and their depth vary by programme and batch.
Tools you will use
Roles this prepares you for
- Data Analyst
- Business Analyst
- MIS Analyst
- BI Developer
- Reporting Analyst
The certificate you take home
Complete the Skill Degree in Data Analytics and you receive a SkillCircle certificate of completion. On the executive programme, the certificate is issued with IIT Patna Vishlesan I-Hub Foundation; the sample below shows that layout.


Upcoming batches
| Batch | Start date | Timing | Mode / Centre | Action |
|---|---|---|---|---|
Ask a counsellor for the next start date at your centre. Ask a counsellor | ||||
Don’t see a timing that works for you? Talk to our admissions team about classroom or online batches, or see all upcoming batches.
Book a Campus VisitSee SkillCircle before you visit
Videos from SkillCircle’s own channel and student videos from our convocations. They load only when you press play.
Messages from our students
Real WhatsApp messages SkillCircle learners sent to founder Shivam Ahuja. These three studied digital marketing with us; they are shown with permission and names as they wrote them.


Last-mile preparation in 3 stages
Placement support: the final stretch before interviews, your profile, your pitch and proof that you can do the job.
Resume
Shaped around your projects and capstones.
A profile that matches the roles you are applying for.
Portfolio
Your capstones, notebooks, dashboards and certificates in one place.
Certifications
Certificates from your programme, listed the way recruiters read them.
Mock interviews
With an HR professional from naukri.com.
Explain a project
The problem, the data, what you built and what you would change.
Common questions
Practise answers on the tools and methods in your syllabus.
Feedback
Clear notes on what to fix before the real interview.
Practical tasks
A take-home dataset or a short case, the kind of task many employers set.
Tools, hands-on
Excel, Python, NumPy, Pandas, MySQL and more.
#JobCircle openings
Openings from our hiring partners on #JobCircle, our in-house job portal.
Recognition and track record

- Best Vocational Institute 2026 from Entrepreneur India, presented by Union Minister Piyush Goyal
- Teaching since 2016, now with 15+ centres in 10 states
- 74,356+ students enrolled so far
- Our homepage lists NASSCOM and Vishleshan i-Hub (IIT Patna) among SkillCircle's industry associations. IBM and Meta certifications are available on selected programmes; ask the counsellor which ones come with your course.


- Ministry of Skill Development and Entrepreneurship
Also on the SkillCircle faculty
Trainers who teach our data science and data analytics courses.
- PSPrashant SrivastavaData Science & Analytics Trainer
- AVAakash VermaData Science & Analytics Trainer
- DGDivyanshu GuptaData Science & Analytics Trainer
- RJRoshan JhaData Science & Analytics Trainer
- MFMauwaz Ahmed FarooquiData Science & Analytics Trainer
- GNGaurav NarwalData Science & Analytics Trainer (Freelance)
- KAKrishna AroraAssociate Trainer, Data Science & Analytics
- AGAkshay GujareAssociate Data Analyst
Trusted by learners, recruiters and the media
Best Vocational Institute 2026
Entrepreneur India
Vishleshan i-Hub (IIT Patna), NASSCOM FutureSkills
Plus IBM and Meta certifications on selected programs.
10 years, 15+ centres
A decade of training learners, online and in classrooms across India.
Our hiring partners






















SkillCircle in the news
Learn from Industry Practitioners
Our mentor network of 100+ industry experts includes founders, business leaders and specialists.
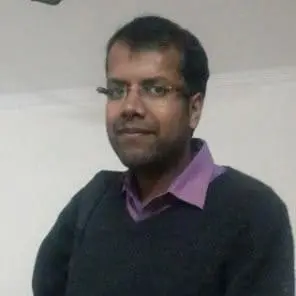
Amit Gupta
VP, Amar Ujala

Pranav Jha
Founder, AP Web World

Nishkarsh Sharma
Dropshipping Expert

Parul Mehta Bhargava
Founder, vCommission

Girish Singh
Head of Marketing, Uber
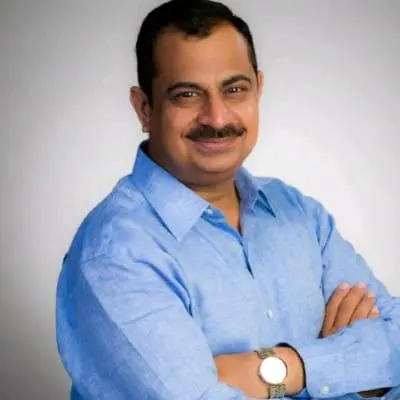
Amit Chawla
Business Clarity Coach
Not sure if this course is right for you?
Talk to a career counsellor about your goals, the next batch and the admission process.