Data science · Languages
Python vs R for Data Science: Which to Learn First?
Both are free, both are excellent for working with data, and plenty of data scientists use both. The real question is which one gets you further, faster, from where you are today.
On this page

The core difference in one minute
Python is a general-purpose programming language. The official Python FAQ describes it as an interpreted, interactive, object-oriented language (Python FAQ). It wasn’t built for data specifically, but libraries such as pandas, NumPy and scikit-learn turned it into a standard tool for data analysis and machine learning. The same language also runs websites, automation scripts and APIs.
R was built for data from the start. The R Project calls it “a language and environment for statistical computing and graphics”, similar to the S language developed at Bell Laboratories (R Project). Statistical tests, models and data frames are part of the core language, and packages such as the tidyverse and ggplot2 make cleaning and charting data very concise.
The simplest way to remember it
Python is a programming language that’s great at data. R is a data and statistics language that can also program. If you want one language for analysis, machine learning and shipping software, Python goes further. If you want the shortest path to rigorous statistics and polished charts, R is hard to beat.
Python vs R for data science: side-by-side
| Factor | Python | R |
|---|---|---|
| What it is | General-purpose programming language | Language and environment for statistics and graphics |
| Cost | Free and open source | Free and open source (GNU project) |
| Data handling | pandas, NumPy, Polars | Built-in data frames, dplyr, data.table |
| Charts | Matplotlib, seaborn, Plotly | ggplot2, base graphics |
| Statistics | SciPy, statsmodels | Built into the language, plus CRAN packages |
| Machine learning | scikit-learn, PyTorch, TensorFlow | tidymodels, caret |
| Package library | PyPI (general-purpose, very large) | CRAN: 25,529 packages (25 Oct 2026), plus Bioconductor |
| Typical tools | Jupyter, VS Code | RStudio (Posit), Quarto, R Markdown |
| Apps and dashboards | Streamlit, Dash, web frameworks | Shiny |
| Beyond data | Web apps, automation, APIs, AI tooling | Mostly analysis, reporting and research |
| Best for | Data science, ML and AI, analysts who want to automate | Statistics, research, biostatistics, academic work |
General patterns, not hard rules. Both languages can do almost every task in the table; the difference is how naturally they do it.
How popular are they?
Popularity matters for one practical reason: more users means more tutorials, answers and job listings. The TIOBE Index for October 2026 ranks Python first among all programming languages and R eighth.
Source: TIOBE Index, October 2026. TIOBE measures search-engine popularity of languages, not quality or salaries, and covers all programming, not just data science.
R’s lower overall rank doesn’t mean it’s fading in its own field. It’s still widely used in statistics, research and life sciences, and its main repository, CRAN, listed 25,529 available packages on the day we checked (25 Oct 2026).
Quiz: which should you learn first?
Answer five quick questions. It’s a rule of thumb, not a final verdict.
The same task in both languages
Here’s one small job, totalling units sold by city from a CSV file, written both ways. Switch tabs to compare.
# pandas
import pandas as pd
df = pd.read_csv("sales.csv")
totals = df.groupby("city")["units"].sum()
print(totals)
Readable, general-purpose syntax. The same pandas skills carry straight into machine learning with scikit-learn.
# tidyverse (dplyr)
library(dplyr)
df <- read.csv("sales.csv")
df |>
  group_by(city) |>
  summarise(units = sum(units))
Very concise for data work. The pipe reads like a recipe: take the data, group it, summarise it.
- Data frames: rows, columns, filtering and grouping
- Joining tables, much like SQL joins
- Statistics: distributions, tests, regression
- Charts that answer a clear question
- Notebooks and reproducible reports
The concepts transfer. That’s why learning a second language is much faster than the first.
Both languages work in notebooks: Jupyter is the usual home for Python, and RStudio for R. Want to see where BI tools fit next to code? Read Power BI vs Tableau.
Pros and cons
Flip between the upsides and the trade-offs.
Python
- One language for analysis, ML, AI and apps
- Ranked first in the TIOBE Index (Oct 2026)
- Huge range of libraries and tutorials
- Easy to move models into production
- Statistics needs extra libraries
- Charts take more code than ggplot2
- Setting up environments can confuse beginners
R
- Statistics built into the language
- ggplot2 makes excellent charts
- Strong in research, pharma and life sciences
- RStudio and Shiny make reports and apps easy
- Less used outside data and research
- Fewer options for production software
- Syntax can feel unusual to programmers
Learning both
- Fit into any data team
- Use the best tool for each task
- Second language comes much faster
- Slower if you try both at once
- Easy to stay shallow in each
- Pick one first, then add the other
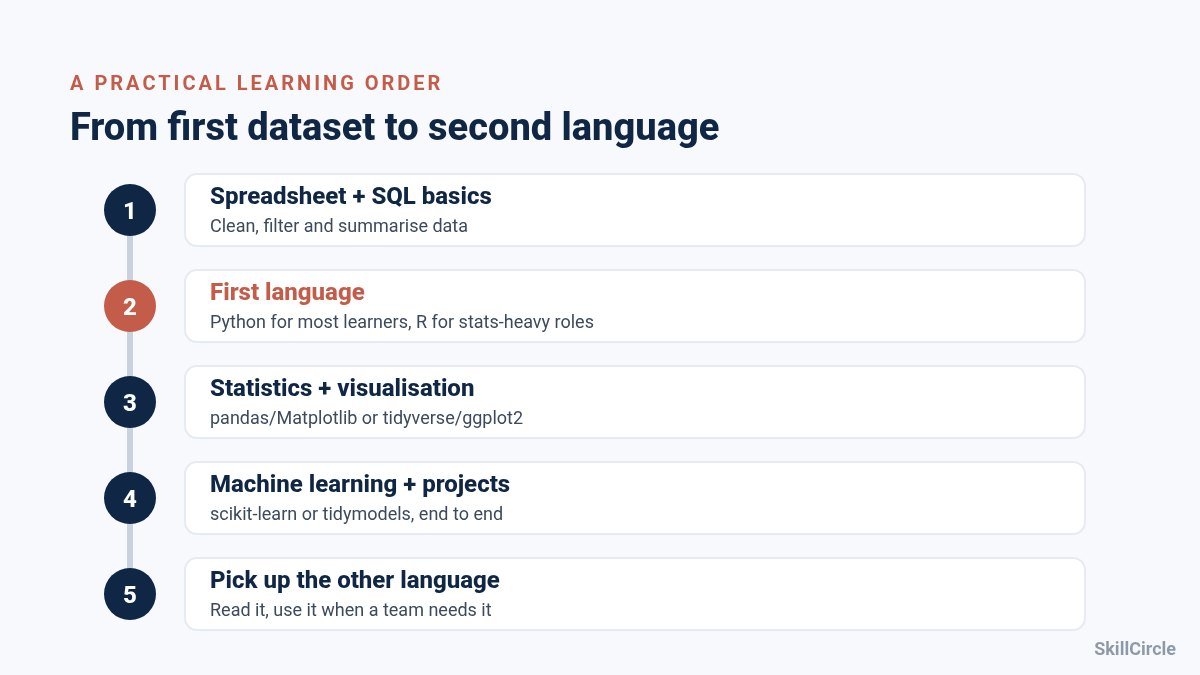
A practical learning order, plus skills checklist
Three tips that matter more than the language
- Learn SQL either way. Almost every data job pulls data from databases, whichever language you use afterwards.
- Don’t learn both at once. Get comfortable in one language with two or three real projects before starting the second.
- Show your work. Projects on real datasets, explained clearly, matter more than which language you chose. Practise with our interview questions.
Skills checklist
Tick what you can already do. Progress updates live.
Choosing a course in Delhi NCR? Our data science course guide for Delhi NCR covers syllabus and how to compare options.
Learn data science with SkillCircle
SkillCircle’s data science and data analytics programmes are taught in Python. The Masters in Data Science covers Python, machine learning, deep learning and NLP, with tools such as Jupyter, NumPy, pandas and scikit-learn. The data analytics track builds the analyst stack. SkillCircle doesn’t currently run a dedicated R course.
SkillCircle has trained 74,356+ learners since 2016, across 15+ centres in 10 states, with a network of 750+ hiring partners. It was named Best Vocational Institute 2026 by Entrepreneur India.
Data Science course in CP Data Analytics course in CP
Data science also in Noida, Laxmi Nagar and Kolkata. Data analytics in Noida.
FAQs: Python vs R
Should I learn Python or R first for data science?
For most beginners, Python is the more flexible first choice: it is a general-purpose language used for data analysis, machine learning, automation and putting models into apps, and it tops the TIOBE popularity index as of October 2026. Start with R first if your work is mainly statistics, academic research, biostatistics or publication-quality charts, or if your team or course already uses R.
Is R harder to learn than Python?
Neither is hard at the beginner level. Python’s syntax reads close to plain English and transfers to other programming tasks. R can feel unusual to people with a programming background, but statisticians often find it natural because statistical models, tests and data frames are built into the language.
Is R still used in 2026?
Yes. R is actively maintained, and CRAN, its main package repository, listed 25,529 available packages on 25 October 2026. R also ranked 8th in the TIOBE index for October 2026. It is widely used in statistics, research, pharma and bioinformatics (for example through Bioconductor).
Can I use Python and R together?
Yes. Many teams use both. Jupyter notebooks can run R as well as Python, RStudio (Posit) supports Python, and R packages such as reticulate let you call Python from R. A common approach is to get strong in one language and learn to read and use the other when a project needs it.
Which is better for machine learning, Python or R?
Python is the more common choice for machine learning and deep learning, with libraries such as scikit-learn, PyTorch and TensorFlow, and it is easier to move Python models into production software. R can do machine learning too, for example with the tidymodels framework, and is strong for statistical modelling.
Do I need Python or R for a data analyst job?
Many entry-level analyst roles focus first on Excel, SQL and a BI tool such as Power BI or Tableau. A programming language is a strong addition. Python is the more common pick across industries, while R is common in research-heavy and statistics-heavy teams. Check the job descriptions you are targeting.
Which language does SkillCircle teach?
SkillCircle’s data science and data analytics programmes teach Python, along with tools such as Jupyter, NumPy, pandas and scikit-learn in the data science track. SkillCircle does not currently run a dedicated R course.
Sources
- Python Software Foundation: General Python FAQ; PyPI.
- The R Project: What is R?; R FAQ; CRAN available packages (checked 25 Oct 2026).
- TIOBE Index, October 2026.
- Libraries and tools: pandas, scikit-learn, tidyverse, tidymodels, Shiny, Bioconductor, Jupyter, RStudio.
- SkillCircle curriculum: Data Science course in Connaught Place.
Ready to start with Python?
Learn Python, statistics and machine learning hands-on. Our counsellors can help you pick the right programme.
Data Science course in CPData Science course in Noida